Is the Phillips Curve still relevant?
Alice Kantor on Dec 21st 2013
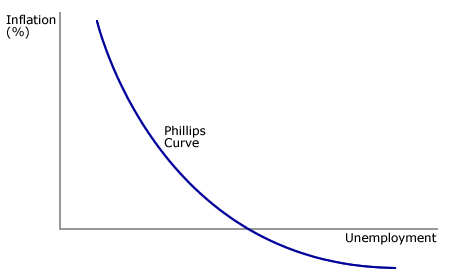
The 1958 Phillips curve establishes a negative connection between the rate of inflation and the rate of unemployment. It supports the idea that a low level of unemployment allows for employees to ask for higher wages (they do not fear unemployment), which subsequently increases the pace of the rising of general prices. The Phillips curve represents this trade-off between unemployment and inflation.
In the 1960s, an estimate of the curve
seemed to correctly encapsulate the functioning of the job market. Today, it
does not seem to be the case anymore.
A time series analysis of the periods
between 1998 and 2012 enables us to draw the Phillips curve of the last decade.
From then on, we can demonstrate that there is no clear connection between
unemployment and inflation in that time period.
For this analysis, we first adjusted the
figures of inflation, so as to neutralize seasonal variations. We devised a
code in the SAS (Statistical Analysis System) programming software, which
helped us achieve that goal. We obtained an ascending linear line, representing
the evolution of the rate of inflation between 1998 and 2012.
We then proceeded
to a cross analysis, relating unemployment to inflation. This led us to a
curve, showing the combined evolution of unemployment and inflation between
1998 and 2012. Finally, data analysis was conclusive in the exhibition of a
long-term rate of unemployment.
Theoretic Phillips Curve
Methodology
We have used the macro-economic data set of the INSEE
(National Institute of Statistics and Economic Studies), updated on 12/12/12.
We have called on the specific rates of unemployment of metropolitan France
from 1998 to 2012, as recorded by the INSEE, in keeping with the ILB
(International Labor Bureau) definition of unemployment and with European
standards. French local regional surveys have been generalized to a national
scaled study. In order to have an estimate of the rate of inflation, we have
chosen a consumer price index based on all goods and services of households
from metropolitan France between 1998 and 2012. The index has been adjusted and
is recorded in a 1998 base-100. The records on rates of inflation are
given per month. In order to compare the set of data about unemployment
given per quarter, we have calculated the average of the rate of inflation per
quarter. Our analysis starts in 1998 because a big enough set of data is
necessary to give an accurate estimate of the Phillips curve and to establish
if there is a link of correlation between unemployment and inflation.
Horizontal lines report cut-off points of the curve.
Phillips Curve between 1998 and 2012
Rate of unemployment (%)
A quick comparison with the theoretic curve shows no sign of a Phillips curve in the 1998-2012 periods. However, we can consider the curve from 1998 to 2001, as well as the one from 2005 to 2008, as short-term Phillips curves. They demonstrate gradual shifts to the right of the original curve, which some economists like Edmund Phelps have explained as the effect of inflationary expectations.
Variables
|
Number
of Observations
|
Mean
|
Standard
deviation
|
Minimum
|
Maximum
|
Unemployment
rate
|
60
|
8.85
|
0.88
|
7.1
|
10.7
|
Inflation
rate
|
60
|
112.19
|
8.39
|
99.7
|
126.44
|
Finally,
between 2001 and 2005, and between 2008 and 2012, we observe the combination of
high rates of inflation (a 26% increase in 2012, from 1998), and high rates of
unemployment (9.7% unemployment rate in 2012), a phenomenon labeled in the
1970s as “stagflation”.
The Phillips relationship is not a valid way to gauge
today’s complex ties between rate of inflation and rate of unemployment in
France. However, Friedman’s allegations about a long-term unemployment rate are
vindicated by the data we have analyzed. Structural unemployment in France
would revolve around 8.9%, a rather high level of unemployment for a
government-intervening market.


Comments
Post a Comment
Please leave a comment and tell us how you feel about the issue, keeping in mind that politeness and respect are essential to constructive discussions.